European coal regions
The European Commission’s
science and knowledge service
Joint Research Centre
Press ? for help
Setting the scene
Coal has been one of the main fuels of the European economy. Today it still plays a significant role as a primary energy source.

16% of the total energy consumption in the EU
Eurostat, 2015

24% share in power generation
Eurostat, 2015
Setting the scene
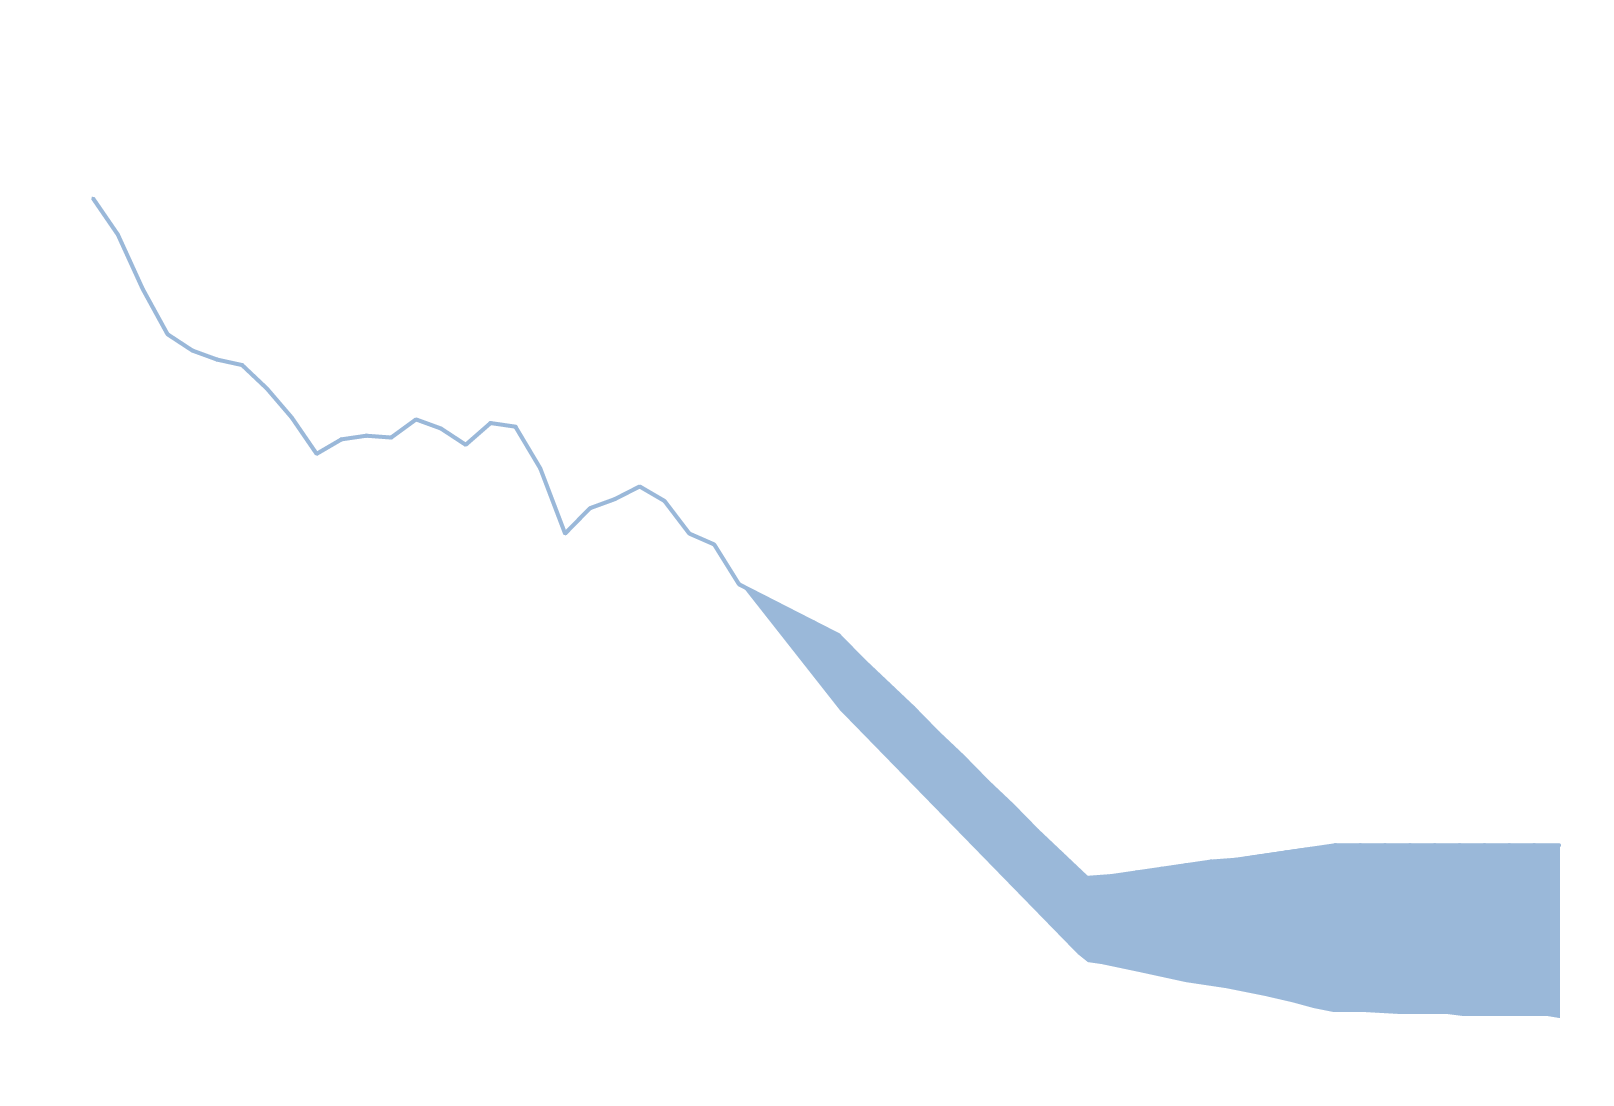
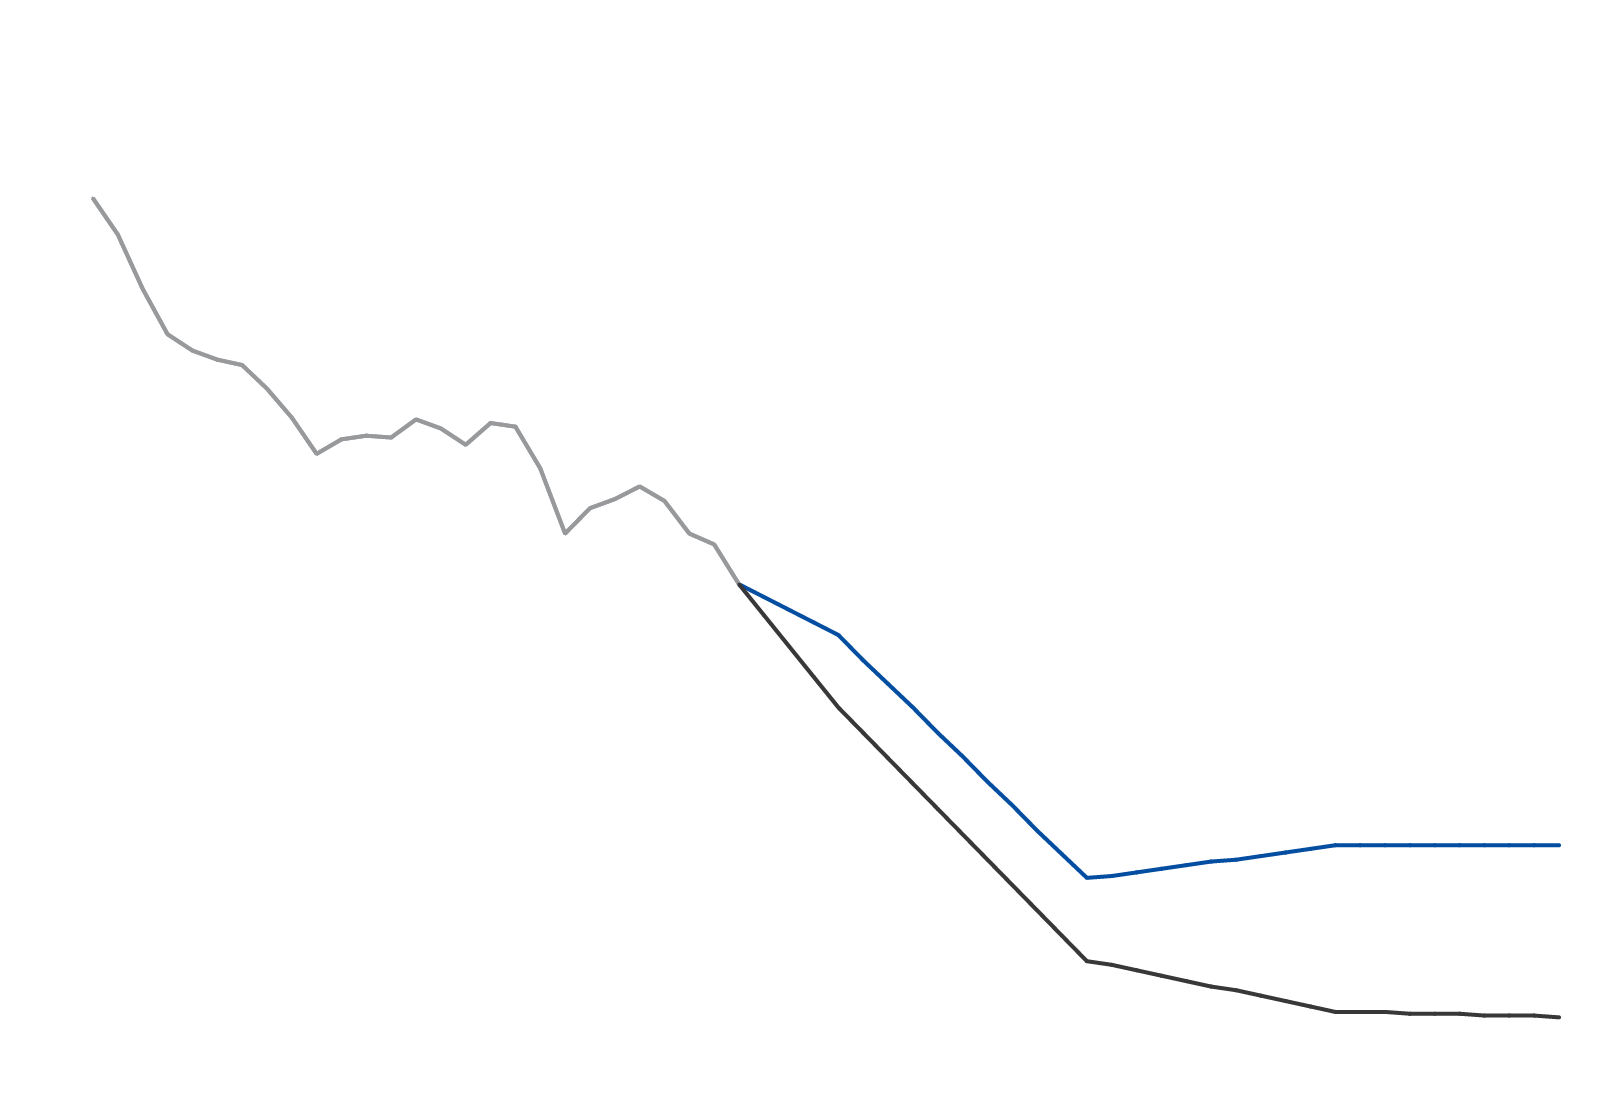
In the future the role of coal is expected to diminish due to both decarbonisation and a more diversified energy mix.
80% decarbonisation achieved with a diversified energy mix
95% decarbonisation achieved mostly with renewables
Total historical and possible future coal use EU28 (Mtoe)
1990
2000
2010
2020
2030
2040
2050
500
400
300
200
100
0


JRC EU-TIMES, 2018


Coal fired power plants
- Coal fired power plants in EU27 and the UK with a total capacity of 150 GW
- 207 power plants
- 53 000 direct jobs (estimated)
View power plants in:
Coal mines
- 150 operating coal mines (estimated)
- 500 million tonnes in 2015
- 185 000 direct jobs
- > 75 000 indirect jobs (estimated)
View coal mines:
Geography of Jobs
Potential power plant closure scenarios
MW
150,000
100,000
50,000
0
Based on ENTSO-E TYNDP 2016 - vision 4 scenario
Estimated coal direct jobs at risk
Jobs remaining:
Potential jobs at risk:
2016


2020


15% (35,000 jobs)
2025


42% (99,000 jobs)
2030


72% (171,000 jobs)
The analysis was based on the assumption that
power generation is the main driver behind mine closures after 2020
power generation is the main driver behind mine closures after 2020
Opportunities
and revitalisation
examples and potential for the regions
Solar and wind potentials
in regions currently hosting coal mining
infra-structure
European coal regions
The European Commission’s
science and knowledge service
Joint Research Centre
JRC C.7 Knowledge for the Energy Union
October 2017, Petten